A pie chart is a common tool for showing part-to-whole relationships—for instance the composition of marital statuses in Pennsylvania, USA. The idea behind a pie chart is to take a single object (i.e., PA residents), and break it apart into components representing a particular categories (i.e., marital status). In the case of pie charts, we call these components “slices.” The relative size of the component represents the relative contribution from that category. In this sense, pie charts are quite similar in idea to divided bar charts, Marimekko charts, tree maps, and Voronoi diagrams. Also, it should be obvious that a pie chart is closely related to a donut chart.

How to construct/interpret a pie chart #
An absolutely critical aspect of pie charts to recognize is that it is the relative size of the slice reflects the contribution of the component associated with it. Since the pie chart is a 2D object, it is the relative area of the slice that is important. The reason to realize this is that, if you attempt to make a slice stand out by making it larger, then you are creating an ill-formed pie chart.$^\dagger$ The relative area is what is important.
IMAGE (mistake in making slice too large)
With this in mind, the simplest (and most common) way to construct a pie chart is to draw a circle of constant radius, and then divide up the circle into its relative components. You can conceive of this by starting with a radial line drawn at 0 degrees from the $y$-axis. Then you can draw a new line at an angle ($\theta$) given by the relationship $\theta = \frac{\textrm{category size}}{\textrm{total sample size}}*360$. In other words, you are moving around a full circle ($360^\circ$) by an amount equal to the relative size of that category. You can then start at this new line and repeat the process, thereby dividing up the circle to produce a pie chart.
IMAGE showing this process.
Because this is the simplest way to construct a pie chart, there is a temptation to associate the angle with the magnitude of the value. But I must emphasize again that it is the relative area of the slice that is important. The only reason that we were able to use this simple algorithm is because we had a circle with a constant radius!
When to use a pie chart #
Pie charts are best used for data where:
- The data sums up to a whole.
- The data is broken up into categories that are mutually exclusive.
- There is a small number of categories (say 6 or less)
- No more than one category is very small compared to others (say, less than 1%)
Let us consider these guidelines.
1. The data sums to a whole #
Imagine that you wanted to know something about the geographical mobility of people in Pennsylvania, USA. You could head to this page, which lists data on people who moved recently and breaks this up into 4 categories:
- Moved within the same county: 5.5%
- Moved from a different county in PA: 2.7%
- Moved from a different state: 1.9%
- Moved from abroad: 0.6% Though it might be tempting to make a pie chart of this data, you need to be very careful to think about what it plots. For instance, you should not title this: “mobility of residents of PA”. Why not? Well, the clue is in the fact that the total of percentages only adds up to 10.7%. Thus, these categories to not sum up to a whole! One category is missing: people did not move. If you add this category in, then you can make the pie chart.

This is not to say that you cannot make a pie chart of the above 4 categories, you just need to be aware of what whole it is representing. It is not representing mobility, but for those that moved, where did they move from. A better title for such a chart might be “Most PA residents who moved, did so within their own county.”

2. Mutually exclusive categories #
Another potential pitfall is attempting to use categories that are not mutually exclusive. Consider the data is disabilities in PA:
- Hearing difficulty: 3.7%
- Vision difficulty: 2.5%
- Cognitive difficulty: 6.7%
- Ambulatory difficulty: 7.1%
- Self-care difficulty: 2.8%
- Independent living difficulty: 6.6% At first glance, it seems like you could just make a pie chart of this and title it “composition of disabilities in PA.” However, there is some ambiguity as to if this is actually correct. The issue is that it is quite possible that a person could have both hearing difficulties and vision difficulties.
To see why this is a problem, let us consider a simplified case:
Imagine that there was only two categories that we were asking about: hearing difficulties and vision difficulties. Then imagine we polled 100 people. Of these 100 people, 15 only had hearing difficulties, 10 had only vision difficulties, and 5 had both hearing and vision difficulties. If we naively count these cases, we might decide report that 20 (15+5) people had hearing difficulties and 15 (10+5) had vision difficulties. If we just take these numbers directly, we might conclude that $\frac{20}{15+20}\cdot 100\%=57\%$ of people with disabilities have hearing difficulties. But this is not true! The reason is that we have counted the people with both disabilities twice.
Let’s be a bit more careful. The total number of people that report have a disability is 30 (15+10+5). Of these 20 had hearing difficulties (15 with only hearing, and 5 with both). In other words $\frac{20}{30}\cdot 100\%= 66\%$ of people with disabilities have hearing difficulties. This is both correct and significantly larger that what we calculated above.
Thus, when making pie charts, you need to be either very careful about how you are counting, or to be careful in how you construct categories. If you make categories that are mutually exclusive, then we can readily make pie charts of them. For instance, if we make three categories: hearing only, vision only, and both, then it is no problem to make a pie chart directly from this data, as no one can belong to two different categories, and we cannot make the mistake of double counting anyone.

3. Small number of categories #
A common issue encountered in data visualizations is trying to show too much data. This is particularly a problem when making pie charts, and the internet is rife with examples of people making absolutely ludicrous pie charts with absolutely stupid numbers of slices.
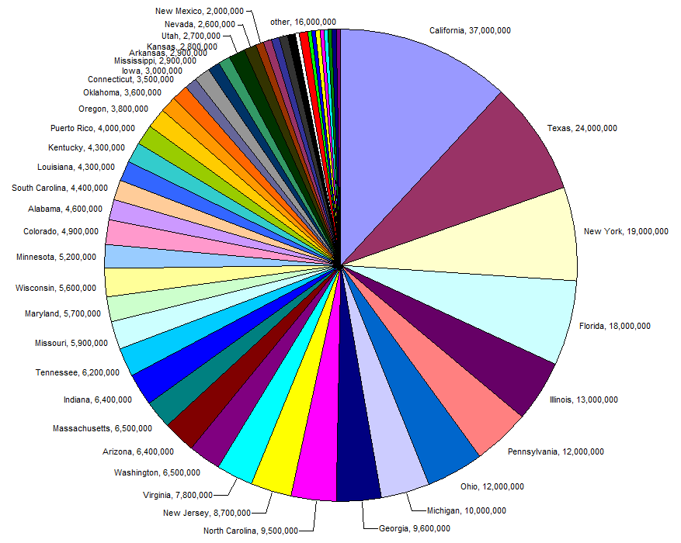
In my personal opinion, I think pie charts are best when there are 2-3 slices, but can be functional up to even 7 slices, though that is rare. My advice is to think very hard about a pie chart that has 6 or more slices.
4. Limit the number of (relatively) very small slices #
When a slice is very small, it can be hard to see. When there is only one such slice, then perhaps it can be used to make a point about how small that category is:

But when you have multiple very small slices, then it can be hard to compare their relative sizes. But the entire point of a pie chart is to compare the relative sizes. Thus, if slices are too small to compare, why make a chart with them?

Design considerations for pie charts #
Now that we have an idea of what pie charts are for, and the sort of data that can be used for them, let us consider some aspects of their design. We can work with the same demographic data source we have been using, plotting marital status in Pennsylvania:
- Currently married: 49.5%
- Divorced: 9.5%
- Never married: 34.7%
- Widowed: 6.3% If you use this data directly, many programs will output a chart much like that shown below.

While this does meet the requirements for a well-formed pie chart, it is not really well-designed. So, let us consider what we might change to make a better designed chart.
Directly label the slices #
As discussed in the page on proximity and separation, the use of a legend is a problem in the design of charts. Rather than using a legend, you can just directly label the slices.

Order slices by magnitude, starting at the top #
The data was supplied with the categories in alphabetical order. But this really isn’t the most useful ordering. Instead, it is often best to order pie slices by magnitude. There are a few reasons for this, but probably the best is that it makes it clear which slices are smaller than others. IT can be surprisingly difficult to judge the size of slices that are separated. For instance, in this plot, we can ultimately understand that the “widowed” category is smaller than the “divorced” category, but it does take a bit of thought. On the other hand, if we simply order slices from largest to smallest, then no effort is needed.

Here, we placed the largest slice, staring at the top, which I think works well, and then the slices decrease in size clockwise. I think this mirrors the most common circular object we “read”—a clock. Though other orders can make sense, I think this is the best place to start.
Consider color scheme #
Plotting programs have no idea what connection you see between data. Colors are chosen to try to make slices easy to tell apart. However, there are times that you might wish to have some slices seems more similar to others. For instance, our data could be divided into people that never married, and those that have been married. We can choose a color scheme to emphasize this connection.

Consider if you need dividing lines #
If colors are different enough, you don’t really need lines between the slices.
Leaving out the line produces an minimal feel that is quite modern.
Of course you can go the other way, and make the lines very thick, producing an almost retro feel.

You can also use white lines, to make the slices feel broken out a bit.

Though you should be aware that this will slightly change the perception of the slices, so this won’t work well when you have very thin slices.
Consider “exploding” to call attention to a slice #
If you want to make a slice stand out, you have all the usual tools discussed on this site for realizing contrast, but you also have one other: you can “explode” a slice or two, which involves translating the slice radially away from the middle. For instance, if we wanted to call attention to the “widowed” slice, we could create the following:

This allows one to preserve the color scheme, while still drawing attention to the slice.
Alternative charts #
There may be times that you want to show the sort of relationship that pie charts show, but the pie chart is not working for some reason. In this case, you can consider a few other options.
- if you have multiple very thin slices, then you might consider a divided bar chart instead, as it is a bit easier to represent such slices. Another option is a Marimekko chart, which allows one to adjust the width of the segments to accommodate multiple small segments.
- If you have too many slices, you might consider a divided bar chart, or even a treemap or Voronoi chart—though be aware that even for these, it is possible to create charts that are not easy to interpret.
Tutorials #
If you want to see me walk through the creation of a pie chart, including formatting of it, you can do so here.
$^\dagger$ A better way to make a pie slice stand out is to “explode” it—or pull it out away from the other slices. It is also worth noting that there is a type of chart that does use different sized slices, notably the rose chart invented by Nightingale. But these are distinct from pie charts.